Better AI Models Won't Fix Your Engineering Team — Nicholas Arcolano, Jellyfish
Nicholas Arcolano of Jellyfish uses data from about 50,000 engineers across 447 companies to test what really drives AI coding output. A natural experiment forcing users onto Grok barely moved merged PRs. The analysis breaks throughput into tool, skill use, token consumption, company and team, and individual engineer, finding the individual and organization matter far more than the model.
Why the model is probably not your bottleneck
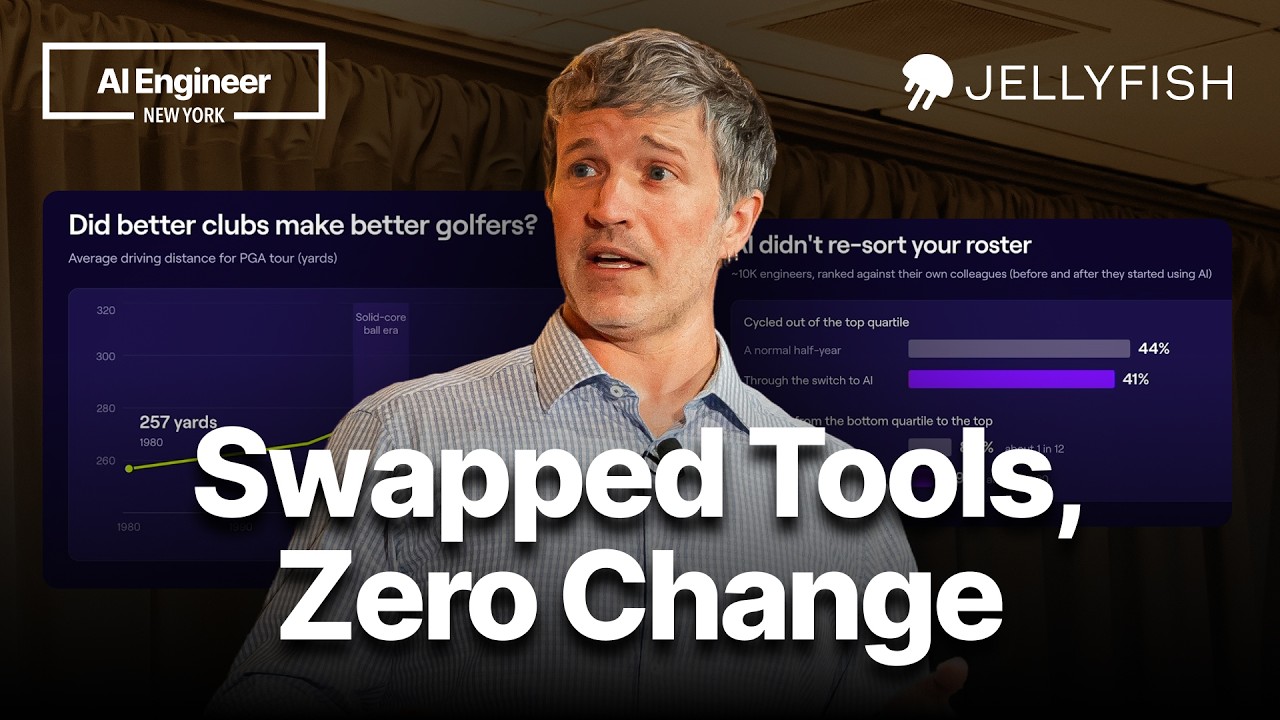
Nicholas Arcolano, head of AI and research at Jellyfish, opens with a golf analogy: when a bad golfer wants better scores, the instinct is to buy better clubs, but the instructor says the fundamentals matter more. The data does show equipment matters. PGA Tour average driving distance rose from about 257 yards in 1980 to roughly 20% more today, and a visible 15-yard jump appeared around the solid core ball era in 2000, a technology-driven step rather than a sudden improvement in golfers. Models are following a similar curve of steady improvement, and that progress is real. The question is how much it shapes output.
A natural experiment: the Grok switch
Jellyfish combines AI coding tool and agent telemetry with engineering workflow and outcome data, drawing on one of the largest datasets of its kind. Around the time SpaceX announced its acquisition of Cursor, Cursor promoted Grok in its UI and changed how auto mode worked, and Grok usage jumped far faster than engineers normally shift model preferences. That made it a natural experiment: an external shock that pushed engineers onto a new model. Plotting each engineer’s shift toward Grok against their change in merged PRs relative to colleagues at the same company showed no meaningful correlation. Output did not change.
Decomposing what drives throughput
The analysis uses a curated subset of about 50,000 engineers at 447 companies, measuring merged PRs per engineer per week for Cursor and Claude Code users. Factors are grouped into four levers, each mapped to the golf analogy:
- The tool (model and harness, the clubs): under 1% of variation in PR throughput. Switching models (Opus vs. Sonnet, ChatGPT), switching harnesses (Cursor to Claude Code), or moving from autocomplete to agentic mode made little statistical difference.
- How well you use it (skills, cursor rules, harness customization, the technique of getting out of a bunker): about 3%. Skill use is currently low. As of the latest data, almost half of engineering weeks showed essentially no skill use, and only 12% reached a level that reflects modern AI engineering practice. Where skill use is high, the effect is large: around 30 or more skill runs per engineer per week correlates with a roughly 30% throughput bump, holding other factors constant.
- How much you use it (tokens, time on the course): about 9%. Across roughly 500,000 developer-weeks, more tokens consistently mean more output, but with diminishing returns, a saturating curve. Moving from the median to the top 10% of consumption roughly doubles output, at about 10x the token spend.
- Where you work (company, team, the course itself): about 12%. Of this, roughly a third is the team and two-thirds the company, covering codebase, review process, and culture. Holding consumption fixed, there is a 2x spread between the top and bottom 10% of companies, so organizational context matters even at identical AI spend.
- You, the individual: the largest share, roughly three quarters of the statistical model’s explanatory power. The spread between the bottom and top 10% of engineers is about 3.5x, wider than the company spread.
Is AI reshuffling who the best engineers are?
A study of 10,000 engineers, using about a decade of longitudinal data, tracked how often top-quartile PR throughput engineers fell out of the top quartile each half-year. About 44% cycled out, and after AI adoption the figure tightened slightly to 41%. The top engineers before AI are largely still the top engineers now. The narrative that AI levels the playing field does not hold up in this data. Craft still matters, which is part of why the individual factor remains so large.
What leaders can control
The tool gets most of the attention, but leaders have little influence over which models or foundation tools exist, and tightening costs limit what they can buy. What they can control is the other side of the equation: people, skills, and the organization. Unlike a golf course, an engineering environment can be reshaped. Leaders can invest in skill development, shape team and company practices, and fix the environment that governs how AI spend turns into output. If outcomes are lagging, the model is probably not the main problem. The people and the environment are.